What Is State-Transition Diagram?
by Nataliia Vasylyna | February 26, 2016 10:15 am
The employees of QA company use various testing tools, which help them to perform software testing more effective and resultative.
State-transition diagrams represent all system operations, states and responses. Such diagrams help to better understand the idea of system functionality. State-transition diagrams consist of several elements.
What Are the Constituent Parts of State-Transition Diagram?
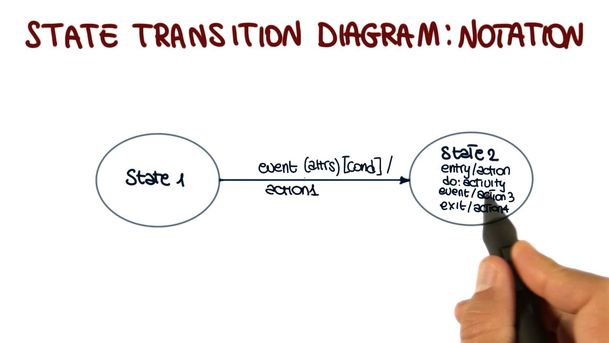
- State (represented by circles). It is a condition in which system is waiting for some events. States contain input combinations (received before) and define the system responds.
- Transition (arrows). It shows the change from one state (circle) to another. This change is caused by the event.
- Event (label on the arrow). It causes the change of system state. Events happen in the outside world but not in the system. They occur momentary. Events can be interrelated or independent. After event has happened, the system may change the state or remain in the same one. Sometimes system may execute particular action.
- Action (command following event). It is an operation caused by the changing of system state. Usually, action makes something be created.
- The starting point is represented by a dot, the ending point – by the bulls-eye symbol.
State-transition diagrams describe the complex system in an easy and compact form. They may be used not only by the specialists of software testing field but also by analysts, designers, etc. State-transition diagram may be represented in a form of table.
Learn more from QATestLab


Related Posts:
- What Is State-Transition Table?: https://blog.qatestlab.com/2016/02/29/state-transition-table/
- What Diagrams Should QA Be Familiar With?: https://blog.qatestlab.com/2017/02/17/applied-testing-diagrams/
- How to Create Test Cases Using State-Transition Diagrams?: https://blog.qatestlab.com/2016/03/01/create-test-cases/
Source URL: https://blog.qatestlab.com/2016/02/26/state-transition-diagram/