- QATestLab Blog >
- QA Basics >
- Analysis of Dynamics of Critical Defects
Analysis of Dynamics of Critical Defects

Over time the number of errors in the test program becomes less and at some point it has become necessary to terminate software testing. Determine this point is not so simple.
There are several approaches:
1. Ran out of money for testing.
2. All defects are found and corrected (I do not know how to do this).
3. All planned tests are performed and there is no one of the active defect on the importance of “Critical.”
4. Reasonable test coverage is provided (any way) and a set of active defects considered acceptable good (according to the approved regulations) for transmission in operation.
5. Curve of active defects was zero for 4 times (a curious method from Microsoft).
6. Expert opinion of an experienced (experience in commercial software development not less than 10 years) quality engineer.
7. Lack of or allowable number of comments on the results of acceptance tests
8. Estimation of the number of undetected defects and defect level software module to be satisfactory on the basis of statistical research:
a. Partial overlapping of the test
b. Artificial insertion of a known number of defects in code under test
c. Sample testing
Expert opinion is often the cheapest and most reliable method of assessing readiness. But it is not so much people to believe it. Indeed, where are facts? How to prove that the software is not ready?
I suggest another method of analysis.
Number of the found errors per unit time is relatively stable value and within the statistical deviations. This is a consequence of several factors.
The first reason. “Trampled grass” can be to infinity. You can always make another improvement and formalize it as a defect.
The second reason. The main testing time is spent on the description of software bugs.
It is no matter will you pass 50 or 1000 scenarios a week – still in the middle you write about the same number of software bugs (30-150 depending on the project).
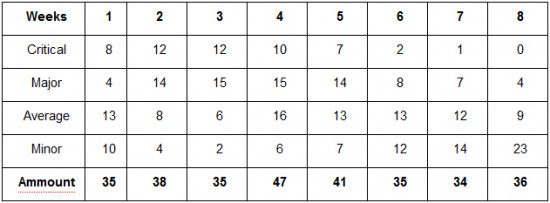
Table 1 Weekly number of found errors in the context of criticality
It is evident that over time the number of critical mistakes has become less and less, and the number of significant errors has decline. This is quite different information and it is already possible to use it.
The next step is in “bringing to a common denominator” of defects with different indicators of importance. It is necessary to invent a function that will use the weight of priorities. A good option was proposed by Taguchi (see “Taguchi loss function”)
In line with this we define the weight functions:
- Critical -16
- Major – 9
- Average – 4
- Minor – 1
The next step is a valuation on labor costs. The number of found errors mostly depends on how many hours of 40 we paid for testing. Effect of a three-day sickness is very high.
You can keep track of the time but it is laborious and the accuracy is not so high. It is much easier to normalize the number of found errors during the period. Thus, we obtain a pure change of errors.
Figure 3. Profile of criticality
It is a fairly typical result. The first time it is growing. This time is exploring the functional.
Then there is a relatively stable area. This is the time when knowledge received at the initial stage allows us to find not only the errors in the text, but also serious problems in the correctness of algorithms. Then natural decline has come.
The value between one and four indicates good condition of the project. Looking at this chart I’m guessing that after the tenth week the testing can be stopped. It is so for certain categories of projects. And if you take the projects with low requirements for defect-free like wordpress, then eighth week was clearly superfluous.
This method of analysis surely has limitations in applicability. These include:
• Separated in time different kinds of tests. Since testing referential integrity reveals many critical errors, but it could go after testing of basic functionality.
• Different parts of the program did programmers with very different experiences.
• You have not accumulated statistically significant amount of input data.
• Etc. etc.
QATestLab is a team of professionals working in various fields to ensure the quality of IT projects: test managers, manual, automated and load testing test engineers, consultants and trainers.
Learn more from QATestLab
Related Posts:
- Definitions and Meaning: Error, Fault, Failure and Defect
- Assessing Bug Priority and Severity
- Statistics of Errors in the Code


Really interesting!
But I don’t understand how you “normalize” to get the 3rd figure?
Can you explain it a bit more please?