
The Most Important Metrics for Automation Testing

If you want to reach success, you must know how to define whether you did it or not. Every value has its measure. In the case of automation testing, this measure is testing metrics.
The metrics, in its pure meaning, is a value of the measurement. Another explanation says that it is a system of measures that displays particular characteristics.
For purposes of automation testing, a metric can be described as a measure that shows past and present conducted tests and applied for defining future procedures.
Automation Testing Metrics: main characteristics
Proper automation testing metrics should have clearly defined goals for automation.
After the goals are defined, it is important to track the test metrics continuously. After careful monitoring, you will be able to decide what deadlines could be changed, what assignments must be added, what procedures to adjust, and what test strategy must be built according to the outcome of the metrics. To ensure the right direction of your test strategy, ask different questions concerning the test procedures.
What to Do with Metrics
While implementing the metrics you have to:
- Define what metrics can show. Clarify a full picture of automation not to use the partial or incomplete display of data.
- Analyze. To use a certain metric, you have to analyze it carefully to extract the benefit from it.
- Filter the results. Metrics may show irrelevant data, which is not necessary for estimation. Define the needed information which directly displays the essential parameters of automation.
- Make use of integration and acceptance tests. The test team can easily check the statistics on unit tests. But, more complicated tests need more careful tracking. It is important to see the
- entire test picture to include it in the final report documentation properly.
The Most Important Metrics and Measurement
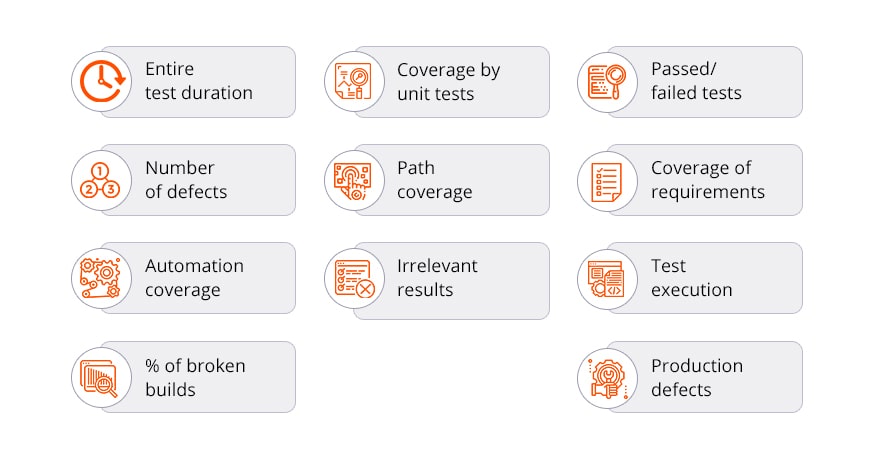
Metric 1. Entire test duration. This metric estimates the time spent to perform all automation tests.
Pros: The test time estimation is an essential part of the testing as it defines the efforts that must be done by a test team and resources that must be dedicated.
Cons: Even the most carefully tracked time of testing does not display the software quality as it shows only the duration.
Metric 2. Coverage by Unit Tests. This metric shows how much unit tests performed to check if they cover the whole code.
Pros: Such a metric gives an understanding of how good the software codebase is.
Cons: Unit tests examine only a certain unit. They can cover each unit, but there is no guarantee that all tested units will form a successful functioning of the entire software. What is more, such tests usually check the code, which is uploaded to the memory. Often the major part of the code is not recorded to the memory, and that is why the full examination of a codebase is not possible.
Metric 3. Passed or Failed Tests Percent. This metric just shows the number of successful and failed tests the same as tests that have to be executed.
Pros: The tracking of percentage gives an opportunity to monitor the testing progress. It allows comparing the progress of each testing circle by composing the batches with passed, failed, and unperformed tests to know the trend of testing and predict the outcome.
Cons: Simple monitoring of conducted tests cannot give information about the products’ quality. Even if the percent is exact and each test is considered, this cannot be the warranty that the quality of the product is increasing, and for QA it is rather an important point.
Metric 4. A number of defects. Here, the metric counts defects, which were found valid during the testing circle.
Pros: This allows to compare tested product with previous releases and adjust its quality. There is a predictable function that defines what defects can be found under particular conditions.
Cons: In the case of precise testing, this metric may found bugs that are not very important and have not much influence on functionality. The metric may be misleading and show not essential issues that attract testers’ attention from the testing scope.
Metric 5. Path coverage. This metric shows the conditions of each path under testing.
Pros: Here you need more detailed testing which increases the quality of tests. Each program statement is executed once in full path coverage.
Cons: The more branches are, the bigger the variety of paths. Amendment of one “if” to the statement can multiply the number paths in twice.
Metric 6. Coverage of Requirements. These metrics show the features under testing and the number of tests depending on user requirements.
Pros: The importance of this metric is in tracking the number of features that are fulfilled according to the customers’ needs and if they are covered by tests.
Cons: Test, which examines only a single requirement, can check only particular elements, so the value of such a test is not high.
Metric 7. Automation Coverage. Here, the number of executed automation tests is displayed in percentage, compared with the total test coverage
Pros: Like the majority of metrics, this one shows the testing progress and the effectiveness of the automation appliance.
Cons: Automation sometimes cannot disclose all the issues, which manual tests can show.
Metric 8. Irrelevant results. Here is a comparison of the irrelevant and useful results in automation testing. For example, useful results mean that test failed because of a defect. Irrelevant results may mean that the reason for failure is in the test environment issues or amendments to the product.
Pros: Displaying of results can help to spend the testing efforts more effectively focusing on useful results. The picture of both results allows to understand the source of irrelevant ones and reduce them by comparing with useful ones and defining their percentage.
Cons: This picture cannot help with product quality issues but only states the condition of tests.
Metric 9. Test execution. Here is the part of the executed tests, which form a build.
Pros: This statistic displays if the executed tests were performed as it was expected and offers to analyze their results.
Cons: As in other metrics, a detailed percentage is not enough to guarantee the quality release. Information about execution can show how many tests were successful, but the direct dependence of the end result on it is not high.
Metric 10. Broken Builds Percentage. Automation tests can fail and “break” the build. This metric shows the broken builds caused by failures in tests and codebase quality.
Pros: This metric displays the actual code quality, and if the percent of broken builds is going down, this means that engineers act more responsible towards changes in the codebase.
Cons: Excessive attention to this data may cause a random choice of issues and their fixing focusing on the detected broken builds instead of the performance of prioritized test tasks and its main direction.
Metric 11. Production Defects. The metric which performs the main task of testing. It defines the number of detected bugs.
Pros: Such a metric allows to track the risen issues and adjust testing with the addition of new automation tests to catch similar issues in the future.
Cons: Some of the found problems may not be the defects which affect the quality on a serious level. Also, it is better to detect defects earlier, than in the production stage. They must be found in the development circle.
Summary on Automation Testing Metrics
The mentioned examples of metrics are important to define the reasonability of testing procedures and the necessary efforts. They provide testers with a clear vision of conducted tests and their impact on product release. To perform proper monitoring, it is important to apply the right metric for the right test. To use metrics as an effective tool in quality assurance, QATestLab offers a range of tips in this and other fields of testing for your review in our blog.
Learn more from QATestLab


Related Posts:
About Article Author
view more articles


No Comments Yet!
You can be the one to start a conversation.